VENTANILLA - CALLAO (PERÚ)
Telefax.511. 553.0981. E-mail. lebr7@yahoo.com


VENTANILLA - CALLAO (PERÚ) |
|
|
| •
Página principal • Indice de productos |
• Venta
de productos • Páginas peruanas |
• Venta
de Maquinarias • Programas Gratis |
• Más
Monografias • ENLACES |
|
Bienvenid@s a La Página Virtual de ALNICOLSA del Perú S.A.C. Telf: 5530981 - Ultima Actualización |
| Keywords Anion-exchange chromatography Caesalpinia spinosa (tara) Differential scanning calorimetry Ellagic acid Gallic acid Hide-powder test Hydrolyzable tannins Pulsed amperometric detection (PAD) Stiasny test Thermogravimetric analysis |
Summary
In this
paper, an extract from fruits pods of Caesalpinia spinosa (tara) a
native leguminosae widely distributed in Peru, known by its high
tannin content is evaluated for its utilization in wood adhesives. |
Introduction
Vegetable tannins are natural products of relatively high molecular weight
which have the ability to complex strongly with carbohydrates and proteins. In
this context, they are the most important natural products used industrially,
specifi-cally in leather tanning processes (Slabbert 1992; Bliss 1989) and in
the synthesis of wood adhesives (Pizzi 1994) to replace phenol in
phenol-formaldehyde adhesives.
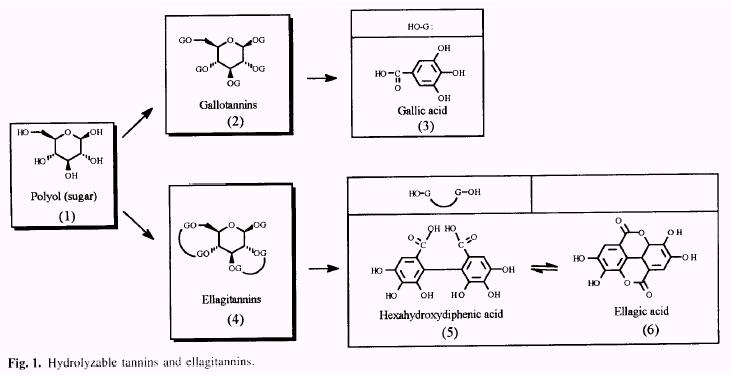
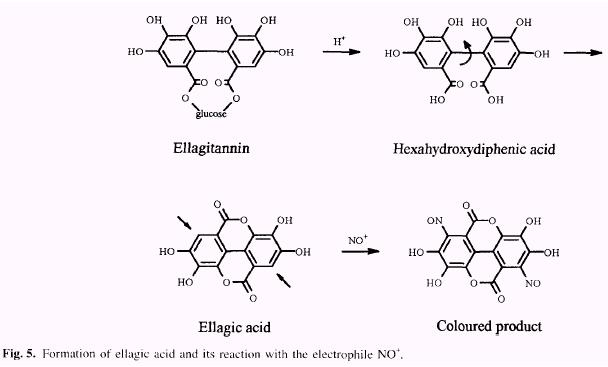
Vegetable tannins are classified in two major groups: the hydrolyzable and condensed tannins. The hydrolyzable tannins (Fig. 1) (Haslam 1966, 1989) are readily hydrolyzed by acids (or enzymes) into a sugar (1) or a related poly- hydric alcohol and a phenolic carboxylic acid. Depending on the nature of the phenolic carboxylic acid, the hydrolyz- able tannins are usually subdivided into gallotannins (2) and ellagitannins (4). Hydrolysis of gallotannins yields gallic acid (3) while that of ellagitannins, hexahydroxydiphenic acid (5), which is isolated normally as its stable dilactone, ellagic acid (6).
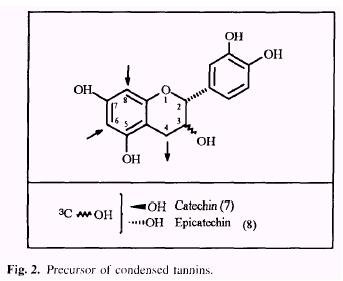
The condensed tannins or proanthocyanidins (Haslam 1966, 1989) are polyflavonoids in nature, consisting of chains of flavan-3-ol units. The most common class of proanthocyanidins are the procyanidins which consist of chains of catechin (7) and/or epicatechin (8) (Fig. 2) linked 4 + 6 or 4 + 8. In contrast to hydrolyzable tannins, condensed tannins undergo polymerization to the amorphous phlobaphens or tannin reds, under action of acids.
|
Hydrolyzable tannins from chestnut bark have been
used, successfully, as partial substitutes (up to 50%) of |
 |
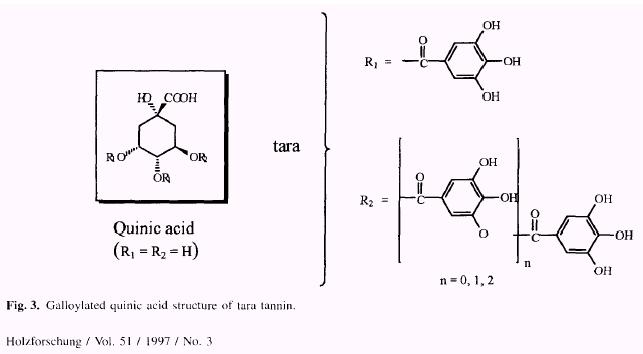
Notable work was carried out by Haslam et al. (1961, 1962) and Horler and Nursten (1961) who demonstrated that principal components of tara tannin were based on a galloylated quinic acid structure (Fig. 3), Thus they differ from other members of the hydrolyzable tannin group which are based upon a galloylated or ellagoylated hexose.
Thus, formaldehyde reaction at the ortho position of a sufficiently large number of galloylated rings of tara tannins, would open the door to the formation of a three dimensional structure (cross-linking) upon curing, This type of network is generally regarded as the best adhesive system. However, the formation of such a system would be possible only if the ester groups remained untouched. Otherwise, hydrolysis would liberate gallic acid and thus, only two sites would be available to react with formaldehyde at both ortho-positions of the free gallic acid preventing formation of a three-dimensional thermoset network.
Previous work on the reaction of gallic acid with formaldehyde (Garro Galvez et al. 1996) showed that optimal conditions are a molar ratio F/P of 2 at pH 8.1.
In order to determine how much gallic acid is present in tara tannin. a spray-dried aqueous extract was prepared, so as to obtain a tara tannin, Spectrophotometric, chromatographic and thermogravimetric (TGA and DTG) methods were used for its analysis.
In this work, the
possibility of utilization of Caesalpinia
spinosa (tara) in the
manufacture of adhesives was studied.
The pods of this species yield an important amount of hydrolyzable tannins
(i.e gallic acid) that could react with formaldehyde under certain conditions.
An extraction method of gallic acid from tara pods was developed and
differential scanning calorimetric studies were performed in order to
determine the reactivity of these materials towards formaldehyde.
Experimental
Materials
Fruits pods of Caesalpinia spinosa (tara) were commercial product from Peru. Gallic acid was from Aldrich and ellagic acid and Hide Powder from Sigma Co. These were used without further purification.
Tara tannin from tara pods
The tara pods were air-dried and ground to a powder in a Wiley mill (6-mm screen). The powder, was then extracted for 1 hour with water (1:4w/v) at 65°C. The extract was vacuum filtered through celite and spiny-dried to obtain tara tannin (55% yield).
Extraction of gallic acid from tara powder
Tara powder (40 kg: 9% moisture) was extracted for 6h with demineralized water (1:10w/v) at 60°C. The extract was vacuum filtered through celite and concentrated under vacuum at 60°C to one tenth of its original volume. Hydrolysis was carried out with 48% NaOH (1:1.5v/v) for 6h at 102°C. The solution was cooled at 30°C and neutralized with 60% H2SO4 . Adjusting pH at 2 and cooling to 10°C initiated crystallization of crude gallic acid (11 kg). Recrystallization from demineralized water with activated carbon (3: 11 w/w) afforded pure gallic acid (8.9 kg: 97% HPLC purity; 1.48 % moisture content and 25 % yield from tara powder. anhydrous base).
Moisture content (Karl-fischer Method)
The samples of tara
tannin and gallic acid were analyzed with a Metrohm E 547 automatic Karl-
Fischer titrator utilizing a dead stop endpoint method. The titrator had an
attached E 415 Multi Dosimat motor-driven piston burette with drum counter
indicator.
The samples (200 mg) were introduced into the titration vessel and dispensed
into the middle of the vessel solution, taking care not to allow the sample to
cling to the walls of the vessel. The titration is monitored by the continuous
measurement of current flow in the solution and is terminated when the current
reading is greater than 15 mA for 30 sec. The volume of titrant (V) displayed
in mL is used to calculate the water content in the analyzed sample as
follows:
| % H2O=100 x V x titer/sample wt, (mg) |
where: titer is the weight (mg) of water that reacts with 1 ml. of Karl-Fischer reagent.
Hyde powder test (Roux 1951; Gordon-Gray 1957)
Samples (400 mg) of tara tannin were dissolved in 100ml. of distilled water. Slightly chromated hide-powder (3gr) previously dried in vacuum for 24h over CaCl2 was added and the mixture stirred for 1 h at ambient temperature. The suspension was filtered without vacuum through a sintered glass filter. The weight gain of the hyde-powder expressed as a percentage of the weight of the starting material was equated to the percentage of tannin in the sample.
Stiasny test (Hillis and Urbach 1959; Hillis and Yazaki 1980)
Samples (100mg) of tara tannin were dissolved in 10mL distilled water. 1 mL of 10M HCl and 2mL of formaldehyde (37%) were added and the mixture heated under reflux for 30 min. The reaction mixture was filtered while hot through a sintered glass filter. The precipitate was washed with hot water (5x 10mL) and dried over CaCl2 . The yield of tannin was expressed as a percentage of the weight of the starting material.
|
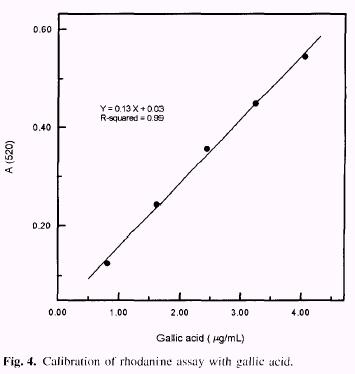
Gallic acid determination (Hagerman and Inoue 1988) Samples (50mg) of tara tannin in 5 mL of 2N H2 SO4 were put into constricted test tubes and frozen. The tubes were vacuum-sealed and heated for 24h at 100°C. The tubes were cooled, opened find the contents made up to 50.0mL with water. Then 1.5mL of 0.667% w/v rhodanine in methanol (freshly prepared) and 1.0mL of sample were mixed. After exactly 5min 0.5N KOH solution (1.0mL) was added. After 2.5 min the mixture was diluted to 25.0mL with distilled water and 5-10 min. later the absorbance at 520nm was measured. The measured absorbance obeys the rela-tionship: A520 = [0.l3 × (mg of gallic acid) ] +0.03 (Fig. 4). Gallic acid was used as a standard and the data were based on experi-ments carried out in triplicate. |
 |
Ellagic acid determination (Hagerman and Wilson 1990)
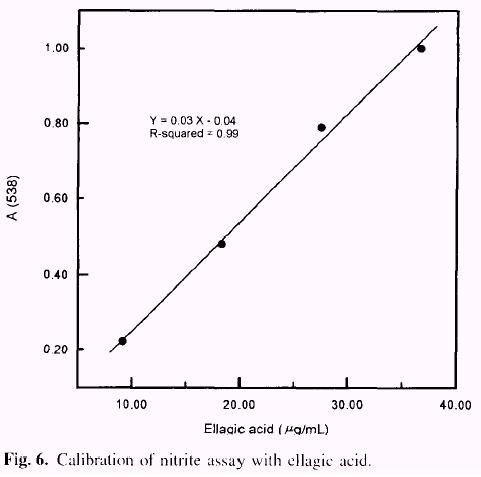
Samples (10mg)of tara tannin in 2N H2SO4 (1mL) were put into constricted test tubes and frozen. The tubes were vacuum-waled and heated for 24h at 100°C. Tubes were cooled, opened and the filtered content made up to 10.0mLwith pyridine.Then 1.1mL of pyridine and l mL of sample were mixed in a dry test tube. After adding 0.10 mL of concentrated HCl and mixing, the sample was brought to 30°C. The sample was quickly mixed after 0.10mL of 1% (w/v) NaNO2 in H2O was added, and the absorbance 538nm was immediately recorded. After a 36 min incubating period at 30°C, the absorbance was again recorded. The difference between the initial absorbance and the absorbance at 36 min. ( D A538 ) was proportional to the ellagic acid concentration. The measured absorbance obeys the relationship: A538 =[0.03 × (mg of ellagic acid)] - 0.04 (Fig. 6). Ellagic acid was used as a standard and the data were based on experiments carried out in triplicate.
HPLC determinations (Haluk et al. 1992)
Samples (4.8g) of tara tannin in H2 O (9 mL) were hydrolyses in alkaline conditions [refluxed in 40% NaOH (4.2 mL) for 6h (pH = 12 - 13)]. After neutralization (pH = 6.8 - 7) with 62% H2 SO4 , the samples were analyzed with the following elution conditions: isocratic system for solvent H2O/CH3 OH/H3 PO4 in different proportions for gallic acid (975.5/19.5/1 v/v/v) and ellagic acid (449.5/449.5/l v/v/v); flow rate, 1 mL/min.; U.V. detection at 280 nm. Analysis was run on a Lichrospher RP 18 E equipped with a 10cm 5-µm-Lichrocart column (Merck).
Sugars analysis (Pettersen and Schwandt 1991)
Tara tannin extract was dried in vacuum at 45°C overnight. Sugars analysis was performed on the extract to determine free, monomeric sugars and after hydrolysis to determine the total sugars (i. e., free plus combined sugars).
Free sugars
Water (28 mL) was added to a sample of the tannin extract (200 mg). Fucose solution (0.5 mL) of known concentration was added as the internal standard. The sample was solubilized by probe sonication for one minute. Nonsoluble material was removed by filtrating through a nitrocellulose filter cartridge (0.45 mm). The cartridge was thoroughly rinsed with water. The combined filtrate was made to a known volume and analyzed for sugars by anion exchange chromatography as described below.
Total sugars
Hydrolysis consists of a primary hydrolysis followed by a secondary hydrolysis. The dried tannin extract (200 mg) was hydrolyzed (primary hydrolysis) in 72% H2SO4 (2.0 mL) for 1 h at 30°C. The sample was then diluted to 4% H2 SO4 with distilled H2O, fucose was added as an interred standard, and the secondary hydrolysis was performed for 1 h at 121°C, The sample, after cooling, was filtered through a PTFE membrane (0.45 mm) prior to analysis as described below. To measure the extent of sugar degradation during secondary hydrolysis, a standard mixture of sugars was hydrolyzed in parallel. Sugar degradation during primary hydrolysis was minimal and thus ignored.
Anion exchange chromatography
Sugar contents of the solutions prepared above were determined by high performance liquid chromatography using an anion ex-change column and pulsed amperometric detection. The chromato-graphic system consists of a 738 Autosampler (Alcott), a GPM- 1 Quarternary Gradient High Pressure Pump (Dionex), and a Pulsed Ampermetric Detector (Dionex).
Separation of the sample into individual sugars was achieved with a Carbo-Pak PA 1 analytical column (Dionex). A NG 1 Ion-Pak guard column (Dionex) and a Carbo-Pak PA 1 guard column (Dionex) were placed in line prior to the analytical column. The NG 1 IonPak guard column removes hydrophobic interferences by solid phase extraction. A time-programmed valve diverts flow around the NG 1 IonPak guard column 1 min after injection of the sample. The individual sugars were eluted with water at a flow rate of 1.2 mL/min. For detection, 300 mM NaOH was added as post-column reagent at a flow rate of 0.5 mL/min. Prior to each injection, the anion exchange column was conditioned with a mixture of NaOH and sodium acetate for 10 min, then equilibrated with distilled water for 10 min.
Adhesive preparation
Tannin concentration in the extract was expressed as equivialents of gallic acid and the quantity of formaldehyde was estimated accordingly to the molar ratio of formaldehyde to gallic acid (F/Ga) of 2. The pH was adjusted to desired values with 50% (w/w) aqueous NaOH in order not to change the solids contents (48%) of the final adhesive. The reaction was carried out for 15 min at room temperature.
Thermal analysis methods
Thermogravimetric analysis (TGA) and differential thermogra-vimetric analysis (DTG) were carried out in a Mettler TA 400 thermal analysis system with DSC 20. Experiments were done at a heating rate of 20°C/min in static air and sample masses were about 10 mg.
Differential scanning calorimetry (DSC) was performed with software furnished by Mettler which contained the Borchardt and Daniels kinetic model as well as Avrami and most usually en-countered kinetic models used in thermal analysis. A20 to 30 mg sample (anhydrous weight of the liquid sample) was sealed in a high pressure capsule pan which can withstand up to 20 bars. The capsule containing the sample and the reference capsule were transferred to the DSC sample holder assembly which were set at 25°C. A heating rate of 10.0°C/min was used up to 250°C. Temperature and enthalpy calibrations were performed with Indium. Cure kinetics data were analyzed by Borchardt-Daniels method (Borchardt and Daniels 1957; Prime 1981) and ASTM E-698 method (Ozawa 1970; Duswalt 1974). In this case, several different heating rates were used.
Results and Discussion
Analytical results
Various methods of analysis are available nation of tannin concentration in the for the determi-extracts. These methods can generally be grouped into two broad types:
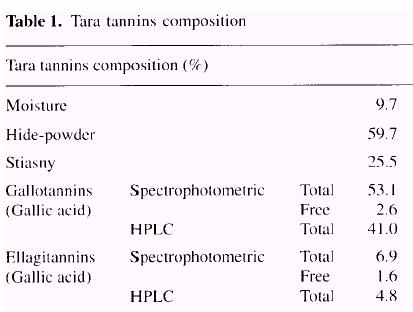
1. Methods aimed at determining what percentage of the extract participates in leather tanning: The classical method officially used by the leather industry is the Hide-powder method. It is based on the binding of tannins to protein and can be performed with simple apparatus. For adhesives, the main drawback of such a technique is its inability to detect monoflavonoids, biflavonoids or phenolic non-tannins present in the extract. which do not contribute to tanning capacity but which do react with formaldehyde and contribute to adhesive properties. According to this test, 59.7% weight-percent of the tara extract is tannin (Table l).
2. Methods aimed at
determining what percentage of the extract can react with formaldehyde: The
classical method is the Stiasny method, based on the reaction of flavonoid
structures of condensed tannin with formaldehyde. Though it is known that tara
tannin is of the hydrolyzable type we have done the analysis for com-parative
reasons. In the particular conditions of this test, only 25.5% weight-percent
of tara tannin is expressed as tannin content (Table 1).
Each method for determining tannin content is only applicable in specific
conditions. The hyde- powder method is used with condensed as well as with
hydrolyzable tannins since both classes of tannins interact with proteins
(Hager-man and Klucher 1986). The Stiasny method is used with condensed
tannins because of the reactivity of its flavonoid structure with
formaldehyde. The results of these two preliminary methods of analysis are in
agreement with the literature (Haslam 1989; Tang et al. 1992) showing that
tara tannins are of the hydrolyzable type. However, it has not been shown
whether tara tannin is a gallotannin or an ellagitannin. In order to further
determine the chemical nature of the tara tannin, we have carried out the
spectro-photometric and chromatographic analyses reported herein,
| Gallotannins
A reliable method for quantitative analysis of gallotannins uses rhodanine to determine gallic acid, Rhodanine reacts with the vicinal hydroxyl groups of gallic acid to give a red complex with a maximum absorbance at 520nm. The un-reacted rhodanine, in the basic conditions of the test, has a maximum absorbance at 412nm and no absorbance at wavelengths higher than 450nm. The red colour was formed only with free gallic acid and not with gallic acid esters, ellagic acid or other phenolics which may be present in the extract. The rhodanine assay was standardized with gallic acid (Fig. 4). The assay gives a linear response with up to 0.2 mg of gallic acid. Two separate assays were carried on, one was done before hydrolysis to quantify the free gallic acid (2.6%) and the other was done after acid hydrolysis to quantify total gallic acid (53.1%). The results are shown in Table 1. |
 |
| Ellagitannins
The spectrophotometric method for determination of ellagic acid is based on the formation of a red quinone oxime (Fig. 5) of the ellagic acid nitrosylation product (electro-philic aromatic substitution). The colour is produced by reacting the sample at 30°C with sodium nitrite in pyridine, using HCl as catalyst. The method is selective, with positive reaction from free ellagic acid but not from a variety of other common plant phenolics including gallic acid, ellagic acid esters, pro-anthocyanidins and flavonoids. The method was standardized with com-mercial ellagic acid (Fig. 6) and the response became non linear at absorbances above 1.1. The smallest amount of ellagic acid detectable was 1 µg. In order to determine free (1.6%) and total ellagic acid (6.9%), two assays were performed on each sample; before hydrolysis find after hydrolysis (Table l). |
 |
Both of the spectrophotometric methods used for deter-mination of gallic and ellagic acid contents of the tara extract were performed after acid hydrolysis. For comparison purposes, wc hydrolyzed the tara extract under alkaline conditions (see Experimental) and, after neutralization, analyzed the hydrolyzate by HPLC. This method indicated that the tara tannin extract was composed of 41% gallic acid and 4.8% ellagic acid.
It is quite likely that gallic acid (2.6%) and ellagic acid (1.6%) are present in small quantities as free acids in the pods of Caesalpinia spinosa. After hydrolysis, gallic acid is liberated to a large extent (41-53%) and ellagic acid in smaller quantities (4.8-6.9%). Thus, it can be stated that tara tannins are predominantly gallotannins rather than ellagitannins.
| Carbohydrates
The sugars
were separated by chromatography over an anion exchange column
followed by pulsed amperometric detection. Samples were analyzed
before and after hydrolysis to determine the amounts of sugars that
occurred in the tara extract as free monomers and in the form of
polymers or other bound sugars. Table 2 summarizes the results. |
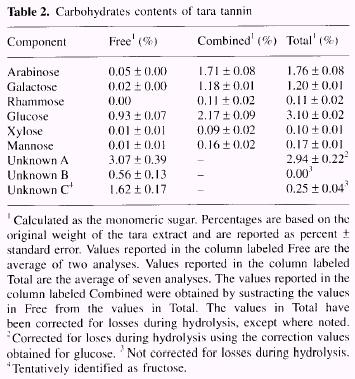 |
In the case of unknowns
B and C, the amount after hydrolysis (identified as "total" in Table
2) was less than that for the uncombined materials (identified as
"free" in Table 2). This indicates that unknowns B and C were not
stable under the conditions used for the hydrolysis of the tara tannin
extract.
Unknown C was tentatively identified as fructose based upon its retention time
during HPLC analysis, the fact that fructose is readily degraded by the
hydrolysis conditions used, and the fact that fructose was identified as a
component of the tara extract by combined gas liquid chromato-graphy/ mass
spectroscopy.
Thermogravimetry
Thermogravimetric analysis (TGA) is a thermoanalytical method, in which the weight variation of a sample heated at a constant rate is measured continuously. From the time derivative of these spectra, differential thermogravimetric analysis (DTG), it is possible to obtain peak temperatures associated with a maximum rate of weight loss. In a previous paper (Garro Galvez et al. 1996) we studied the thermal decomposition of gallic acid. Rcsults reported in this paper shown that three main peaks were detected in the DTG curve. The first one at 260°C (26-27%) corresponds to carbon dioxide release upon heating (decarboxylation), the second peak at 308°C (29%) probably correspond to the further loss of hydroxyls. The third peak at 503°C (45%) corresponds to oxidation of high carbon residue (CO2, H2 O and CO).
The results of thermogravimetric analysis of tara extract are presented in Figure 7. Two main peaks are detected, the first at 260°C has the same peak temperature as that corresponding to decarboxylation of gallic acid. The high percentage of weight loss reported (50-52%) indicates that other constituents than gallic acid in the extract, also gave off CO2 at this temperature. The second peak, at 431°C (39-40%), corresponds to further loss of weight by oxida-tion of residual carbons. It is important to note that carbon dioxide released by carboxylated compounds in tara extract occurs at temperatures above those used in particleboard pressing (150°C-200°C).
| Diferential
scanning calorimetry
Differential scanning calorimetry (DSC) has been used to follow the cure of thermosetting adhesives (Chow and Steiner 1979; Schneider et al. 1979; Christiansen and Gollob 1985) and tannin based adhesives (Fechtal and Riedl 1993). In such experiments, the heat capacity of a sample is compared to that of an inert reference material when both are heated. The polymerization process (cure) will release heat that can be measured as a peak exotherm as a func-tion of increasing temperature. A kinetic model, as the Borchardt-Daniels model, describes the time and temperature dependence of material reactivity. The method assumes that the temperature dependence of the reaction rate constant k (T), follows the Arrhenius expression: k (T) = Ze -Ea/RT where Z is the pre-exponential factor, Ea the activation energy (Kj/mol). R the gas constant (8.31 J/mol. °K) and T (°K) the absolute temperature. |
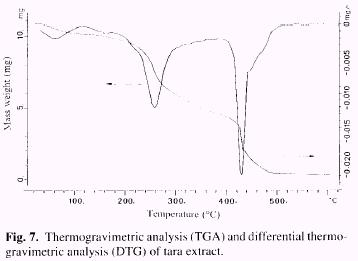 |
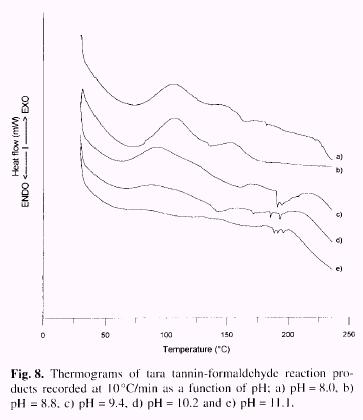
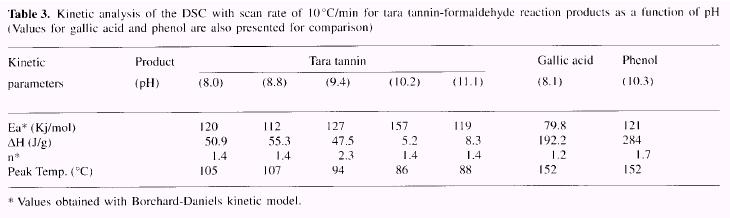
Figure 8
shows thermograms of tara tannin-formaldehyde reaction recorded as a function
of pH values (8.0, 8.8, 9.4, 10.2 and 11.1) and Table 3 the kinetic parameters
obtained from Borchardt-Daniels method.
The trend for the activation energy (Ea) in terms of pH values reached minimum
value (112 Kj/mol) at pH 8.8, to which corresponds a maximum value of the
enthalpy (D H=55.3J/g) of the reaction.
|
Ea represents the minimal energy required for the reaction to take place e.g the higher the value, the more the reaction will proceed at high temperature, and AH represents the energy liberated as a result of the reaction, roughly proportional to the amount of chemical bonds formed. Commercial adhesives such as urea-formaldehyde have a low Ea, especially at low pH, and a high AH while phenol-formaldehyde has a high Ea, and needs high temperatures to cure rapidly, with high D H. Generally a minimal Ea with a maximum AH are required as optimal conditions for a particular reaction. From Table 3, these conditions are best met at pH 8.8. Unfortu-nately the thermogram at this pH (Fig. 8b) shows that the area under the fit (D H) is highly dependent on the baseline selection. For these cases (Schneider 1979), more precise information can be obtained from the ASTM E-698 method. This method is based on the linear relationship between the peak temperatures of the exotherms find the logarithm of the heating rate (Ozawa 1970). The kinetic parameter Ea can be obtained from the following relation: log b = -0.4567 Ea/RTp + cte, where b is the heating rate (°C/min), Ea the activation energy (kJ/mol), R the gas constant (8.31 J/mol.k) and Tp the peak temperature (°K). |
 |
According to Prime (1981), Ea can be obtained from the slope of log b vs l/Tp graph.
The method requires a minimum of three DSC scans at different heating rates and assumes that: the peak maximum represents a point of constant conversion for each heating rate and the temperature dependence of the reaction rate constant obeys the Arrhenius relationship. This peak maximum is evident from the spectra and independent of how the baseline was taken. Different heating rates are used to calculate the kinetics parameters. In contrast the Borchardt-Daniels model uses reaction rate and fractional conversion for the calculations, both parameters being dependent on the peak area which is greatly affected by the selection of the baseline.
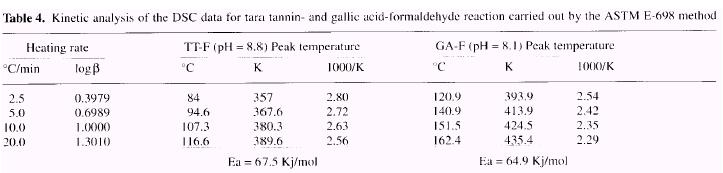
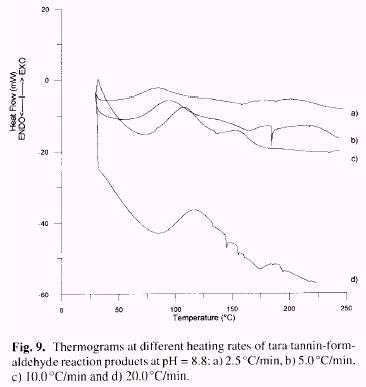
The ASTM E-698 method was carried out for the reaction of tara tannin with formaldehyde (pH=8.8) at four different heating rates (2.5. 5.0, 10.0 and 20.0°C/min). Thermograms are presented in Figure 9 and kinetic parameters reported in Table 4.
Values obtained for Ea are very similar for tara (67.5 Kj/mol) and gallic acid (64.9 Kj/mol). The value ob-tained for Ea by Borchardt-Daniels (Table 3: 112 Kj/mol) is overestimated in comparison with that from ASTM E-698, as previously found for gallic acid [79.8 Kj/mol (B/D) vs 64.9 Kj/mol (ASTM)] (Garro Galvez et al. 1996). Thus while the kinetics of cure, as shown by Ea are acceptable. the ultimate amount of cure, as given approximately by D H is not high: the values for the enthalpies of reaction (Table 3), which are proportional to the amount of chemical bonds formed, for tara tannin-formaldehyde (D H = 55J/g) remain very low in comparison to those for gallic acid (D H = 192J/g) and commercial PF resins (D H = 284J/g), It is especially true at high pH 10-11 (D H = 5.2-8.3J/g) where probably the basic catalyst react with carboxylic groups of gallic acid and no addition of formaldehyde, nor condensation product, shows up.
Conclusion
In Peru, the cost of tara powder is 900US$/ton and the native production reaches 6000 tons/year. Recently, several agroindustrial projects have been oriented to increase the productivity of tara crops, so that the production could reach 12000 tons/year in 2001.
The results obtained in this study show that gallic acid is the main constituent of tara tannins (53%) and it was easily isolated by alkaline hydrolysis of the plant extract (25% yield).
In the total sugars
present in the extract (9.6%). glucose has the biggest concentration (3.1%).
Other constituents are present to a less important extent (i.e. ellagic acid,
6.9%).
Thus tara tannins are predominantly gallotannins rather than ellagitannins.
|
Thermal analysis of the reaction between tannins of Caesalpinea spinosa (tara) and formaldehyde showed that tara tannins are not reactive enough towards formaldehyde and this may eventually be associated to weak mechanical board properties. Even though previous work on gallic acid-formaldehyde showed that this reaction could be achieved under certain controlled conditions, probably the presence of sugars and the consumption of the base catalyst hydrolyzing the ester bonds of the extract reduced its reactivity. However the development of an efficient method for extraction of gallic acid from tara pods suggest a more imaginative use of this compound. Gallic acid could be easily decarboxylated to obtain pyrogallol. This product, like phenol, presents three activated positions for reaction with formaldehyde. Pyrogallo-formaldehyde has been evaluated as thermosetting adhesive for particleboard requiring lower pressing temperatures. shorter pressing times and showing comparable mechanical properties than those boards manufacture with commercial phenol-formaldehyde. These results are presented in a separate study. |
 |
Acknowledgements
We thank the Natural Science and Engineering Research Council of Canada (NSERC), the Fonds pour la formation de Chercheurs et l'Aide ŕ la Recherche (FCAR)-Québec and the Fondation de L'Universtité Laval for a fellowship to JMGG. We also thank Mr. Mark Davis of the USDA Forest Products Laboratory, for performing the sugar analyses.
By J.M. Garro Galvez,
B. Riedl "and A. H. Conner"
Département des Sciences du Bois et de la Foręt, Centre de Recherche en
Sciences et Ingénieric des Macromolécules,
Université Laval, Québec, Canada
USDA-Forest Service, Forest Products Laboratory, Madison, U.S.A.
COPYRIGHT
© 2000 - 2003
ALNICOLSA del Perú S.A.C.
Prohibida su
reproducción total o parcial, así como su traducción a cualquier idioma sin
autorización escrita de su titular
Reproduction in whole or in part, or translation without written permission is
prohibited. All rights reserved