VENTANILLA - CALLAO (PERÚ)
Telefax.511. 553.0981. E-mail. lebr7@yahoo.com


VENTANILLA - CALLAO (PERÚ) |
|
|
| •
Página principal • Indice de productos |
• Venta
de productos • Páginas peruanas |
• Venta
de Maquinarias • Programas Gratis |
• Más
Monografias • ENLACES |
|
Bienvenid@s a La Página Virtual de ALNICOLSA del Perú S.A.C. Telf: 5530981 - Ultima Actualización |
Synonyms:
3,4,5-Trihydroxybenzoic
acid, monohydrate; gallic acid, monohydrate
CAS No.:
149-91-7
(Anhydrous) 5995-86-8 (Monohydrate)
Molecular Weight:
188.14
Chemical Formula:
C6H2(OH)3COOH.(H2O)
|
|
|
Description: White or pale colored crystalline powder; Soluble in acetone, ethyl acetate, 6 parts of alcohol, 2 parts of boiling water, slightly soluble in cold water but insoluble not in benzene or chloroform. Can react with ferricchloride and then appear blue-black colour.
Gallic acid is obtained by the hydrolysis of tannic acid with sulfuric acid or enzyme. When heated above 220 C, gallic acid loses carbon dioxide to form pyrogallol, or 1,2,3-trihydroxybenzene, C 6 H 3 (OH) 3 , which is used in the production of azo dyes and photographic developers and in laboratories for absorbing oxygen.
| Gallic acid can be used in: | ||
|
Pharmaceuticals industry (such as in the synthesis of Trimethoprim); Making antioxidants used in food and feed industries, and ink dyes, and in photography, paper manufacture . |
|
 |
GALLIC ACID, A NATURAL ANTIOXIDANT, IN AQUEOUS
AND MICELLAR ENVIRONMENT: SPECTROSCOPIC STUDIES
KRZYSZTOF POLEWSKI, SEBASTIAN KNIAT, DANUTA SLAWINSKA
Institute of Physics, August Cieszkowski Agricultural University, PoznaN Poland
The spectroscopic properties of gallic acid (GA) and their modification with ionization state in aqueous and micellar environment have been studied. Results show that GA absorbance and fluorescence maxima are pH dependent. It is shown by the shift of the absorbance maximum from 272 nm at pH 2.8 to 260 nm at pH 7. These results are accompanied by fluorescence changes in the intensity, red shift of the position of the emission maximum, shape of the spectrum and quantum yield. Observed changes indicate on the existence of two forms of GA resulting from the proton dissociation at COOH group: neutral form which exists below apparent pKa at 3.4 and anionic form above that pH. To develop a basis for monitoring the interactions of GA with biological compound its absorption and fluorescence properties in heterogeneous and nonpolar media has been studied. No significant partition under physiological conditions was observed. The binding of GA anion to cationic micelle was observed which occurred by electrostatic interaction. In protic solvents GA molecules form very efficiently hydrogen bonds which strongly influence its spectroscopic properties. In low polarity and non-protic solvents GA fluorescence is characterized by enhance in the fluorescence quantum yield and a blue shift in the emission maximum, however, in dioxane its behavior is closer to those observed in protic solvents. In view of the role played by antioxidant properties of some food, including red wine, and some natural drugs these results are relevant to future studies of GA in those materials during its action to fulfill its protective role.
INTRODUCTION
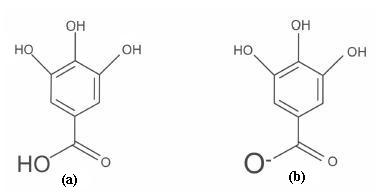
Gallic acid (GA), 3,4,5-trihydroxybenzoic acid, Fig. 1, and its derivatives are biologically active compounds which are widely present in plants (Kahkonen, Hopia, Vourela, Rauha, Philaja, Kujala & Heinonen, 1999; Lee, Lee, Park, Toh, Lee, Jang & Kim, 2000). The chemical and biochemical properties of GA are well described in the literature. According to these references GA is a strong natural antioxidant (Aruoma, Murcie, Butler & Halliwell, 1993, Heinonen, Lehtonen & Hopia, 1998, Khan, Ahmad & Hadi, 2000, Zheng & Wang, 2001). It is able to scavenge hypochlorous acid at a rate sufficient to protect α – 1 — antiproteinase against inactivation by this molecule. GA decreases the peroxidation of ox brain phospholipids (Milic, Djilas & Canadovic-Brunet, 1998). Free radicals have been implicated in the etiology and pathogenesis of numerous disease states including cardiovascular disease, cancer and diabetes (Inoue, Suzuki, Sakaguchi, Li, Takeda, Ogihara, Jiang & Chen, 1995; Sakagami, Satoh, Hatano, Yoshida & Okuda, 1997; Aoki, Ishiwata, Sakagami, Kusama & Katayama, 2001). Free radicals occur as a natural consequence of cell metabolism. They are also produced as results of oxidative stress (Schmidt, Traenckner, Meier & Baeuerle, 1995; Koga, Moro, Nakamori, Yamakoshi, Hosoyama, Kataoka & Ariga, 1999, Terasaka, Tamura, Takayama, Kashimata, Ohtomo, Machino, Fujisawa, Toguchi, Kanda, Kunii, Kusama, Ishino, Watanabe, Satoh, Takano, Takahama & Sakagami, 2000). Antioxidant capacity of gallate esters against hydroxyl, azide, and superoxide radicals has also been reported (Masaki, Atsumi & Sakurai, 1995; Satoh, Ida, Sakagami, Tanaka & Fujisawa, 1998; Bors & Michel, 1999; Pulido, Bravo & Saura-Calixto, 2000; Metelitza, Eryomin, Sviridov & Kamyshnikov, 2001). GA is widespread in plant foods and beverages such as tea and wine and was proven to be one of the anticarcinogenic polyphenols present in green tea (Ho, Chen, Shi, Zhang & Rosen, 1992; Kerry & Abbey, 1997; Abu-Amsha Caccetta, Burke, Mori, Beilin, Puddey & Croft, 2001; Landrault, Poucheret, Ravel, Gasc, Cros & Teissedre, 2001). The consumption in France of a diet high in saturated fat coupled with an apparently low incidence of coronary heart disease (referred to as the "french Paradox") has been associated with the consumption of red wine (Landrault et al., 2001). Antioxidants present in red wine have been shown to have a protective role against oxidation of LDL in vitro (Arce, Rios & Volcarcel, 1998). GA is a strong chelating agent and forms complexes of high stability with iron (III) (Sroka, Rzadkowska- Bodalska & Mazol, 1994, Li, Bandy, Tsang & Davison, 2000). It has shown phytotoxity and antifungal activity against Fusarium semitectum, F. fusiformis and Alternaria altternata (Dowd, Duvick & Rood, 1997). GA is of great interest in arteriosclerosis prevention (Abella & Chalas, 1977)
|
The spectral properties of GA as reflected by the absorption and fluorescence spectra received a little attention. In view of the multiple roles played by GA in medicine and food sciences its fluorescence could be a convenient tool to study the processes where GA is involved. Our results show that GA fluorescence as measured by its intensity, emission and quantum yield is pH dependent. These results are further supported by absorbance changes with pH. In biological milieu GA interacts in heterogeneous environment where its reaction rate, reactivity, conformation and spectral properties may significantly differ from those observed in aqueous, homogeneous solutions. We thus investigated the fluorescence characteristics in nonpolar and micellar environments to enable us to mimic the changes that could take place in GA fluorescence during its action in heterogeneous environment. |
In this paper we have characterized the spectroscopic properties (absorption and fluorescence) and their modulation with the ionization state of GA molecules in aqueous and heterogeneous environment.
MATERIALS AND METHODS
Materials
Gallic acid, propyl gallate and pyrogallol were from Fluka (FLUKA AG, Germany), sodium dodecyl sulphate-(SDS), tetradodecyltrimethylammonium bromide- (TTABr), β-cyclo-dextrin, glycerine and acrylamide were purchased from Sigma Chemicals (SIGMA Co, New Orleans).
Organic solvents were from Merck. (MERCK Co., USA) The buffer used in the range of pH from 3 to 9.4 was sodium ammonium-acetate. The pH value from 2 to 3 was adjusted by adding appropriate volumes of 0.1 M HCl to aqueous sample.
All samples were prepared daily and were measured directly after mixing all components.
Methods
The absorption spectra from 200 nm were taken with SD 1000 spectrophotometer from Avantes (Netherlands) in 1 cm quartz cuvette. The fluorescence spectra were measured in 1cm path-length quartz cuvette with a Shimadzu RF 5001 PC spectrofluorimeter (Shimadzu, Japan) and were then corrected using correction kit from Shimadzu. The spectra were taken at room temperature, 210 C.
The samples were excited at 270 nm which is in the range of isosbestic point to avoid complications with fluorescence intensity determination caused by different absorbances of two forms of GA.
In order to determine the partition coefficients of GA between phases in micellar environment, the obtained spectra were decomposed by fitting procedure using the least square method into appropriate components representing aqueous phase and micellar phase. The partition coefficient was calculated as the ratio of the area of micellar phase component to total area of the spectrum.
The fluorescence quantum yield was determined as described in Lakowicz (1983). As a fluorescence quantum yield standard tryptophan with Φ = 0.13 was used Eftink (1991).
The quantum-mechanical calculations have been carried out with the programs from HyperChem package from HyperCube (Ontario, Canada). For geometry optimization and electron density distribution semi-empirical method PM3 with CI was applied.
RESULTS
Absorption spectra
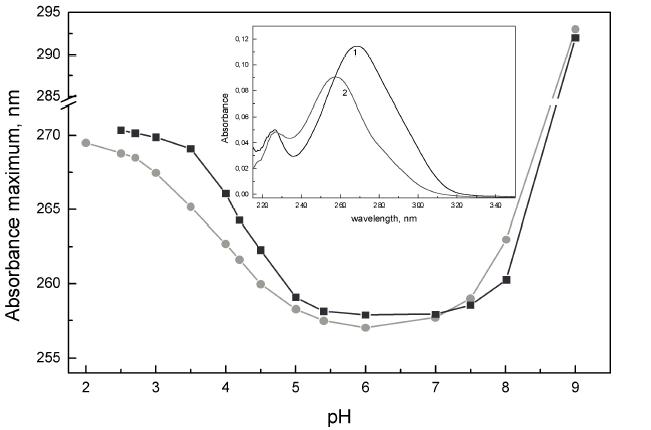
In aqueous solution the absorption spectrum of gallic acid (GA) exhibits two peaks in the UV range. One at 225 nm with molar extinction coefficient ε = 26500 (M–1 cm–1) and the other at 260 nm with ε = 21200 (M–1 cm–1). In buffered solutions the higher energy peak is located between 227 nm and 230 nm. The lowest energy peak shows maximum between 257 nm to 269 nm. The absorption spectra of GA in buffer at pH 2.5 and pH 6 are shown in the inset in Fig. 2. Their exact position depends on the ionization state of GA molecule. The shifts of absorption maximum position of the GA in buffered ammonium-acetate solutions at different pH are shown in Fig. 2.
|
In acidic solutions the absorbance maximum is located at 269 nm. Increasing pH gradually shifts the maximum to 257 nm with sharp change in position at pH 3.5. In the range from pH 4.5 to 7.5 the shift of maximum is small. Further increase of the sample’s pH above 7 leads to the formation of a new, additional peak with maximum at 295 nm. Those results indicate that in buffered solutions may exist different GA forms caused by ionization of the GA molecule. Bellow pH 3.4 we may expect the existence of a neutral form of GA (Ia), with its absorbance maximum at 269 nm. In the range of slightly acidic and neutral pH we observe the anionic form of GA (Ib) characterized by the absorption maximum at 257 nm. At basic pH care must be taken because GA undergoes fast autooxidation what leads to colorization of the solution which is non-fluorescent. The other peak with maximum at 225 nm at pH 2 gradually shifts to 231 nm at pH 7. |
In the presence of the anionic detergent SDS, nonionic detergent TRITON X-100 and β-cyclo dextrin of the buffered solutions of GA the absorption spectra are similar to those observed in aqueous solutions, which indicates that interactions of the above chemicals with GA do not affect its absorption spectra.
The presence of the cationic detergent, TTABr, in GA buffered solutions induces changes in the absorption spectra compared to buffer-only solutions, Fig. 2. At pH 2.7 we observe the shift of maximum to 271 nm. Steeper slope in the pH range from 2.5 to 6 gives higher pKa values compared to buffer solution. It looks like the presence of the cationic micelle stabilizes the position of absorbance at 257 nm from pH 5 up to pH 7.5 compared to buffer-only where the position continually changes with pH. At pH above 8 the presence of micelle slows down the autooxidation of GA compared to buffer solution only. The apparent pKa value derived from Fig. 2 calculated for the changes observed for the lowest energy peak equals 3.34 compared to pKa value equal to 3.13 reported in literature by Bykova, Petrov and Blagodatskava (1970). In TTABr micelles calculated pKa1= 4.3 what indicates that the presence of cationic detergent changes the protonation equilibrium of GA forms.
|
In order to determine the nature of the observed interactions the absorption spectra of GA were taken in organic solvents with different dielectric constant and different protic character. The spectral properties of GA in different solvents are collected in Table 1. The absorption maxima of the peaks in organic solvents are red shifted compared to that in water. Only in 0.1% DMSO solution the maximum is shifted to 256 nm. The positions of the maximum do not depend on the dielectric constant of the solvent and its permanent dipole moment. In dioxane, the solvent with the lowest dielectric constant, 2.2, the maximum is shifted to 268 nm compared to 260 nm in water, in alcohols to 271 nm and to 267 nm for acetonitrile, a nonprotic solvent with dielectric constant close to that of methanol. Such results indicate that we observe specific interactions that in case of GA lead very probably to formation of efficient hydrogen bonding with solvent in protic solvents. |
Fluorescence spectra
Whereas the apparent ionization process and hydrogen bonding formation detected by absorption changes may reflect the behavior of GA only in ground state, the fluorescence of GA will provide information of GA behavior in excited state.
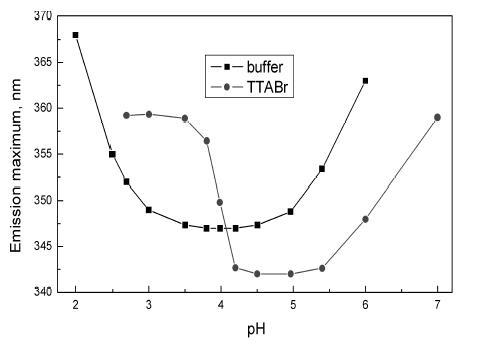
During our experiments the intrinsic fluorescence of GA acid was used to study its behavior in different conditions. Figure 3 shows the change in GA fluorescence maximum position with pH in buffer and micellar solution. In buffer solution the emission maximum of GA changes very fast from 368 nm at pH 2 to 346 nm at pH 3.5 then remains steady up to pH 5. Simultaneously the increase in intensity is observed. The increase in fluorescence intensity is not connected with absorbance changes observed for GA molecules at different pH thus is mostly due to higher quantum yields of the ionized forms of GA compared to that of the neutral form which is very weakly fluorescent. Calculations show that the fluorescence quantum yield of GA increases from 0.004 at pH 2.5 to 0.01 at pH 7.
The observed shift of the maximum above pH 6 is accompanied by a change in the shape of spectrum, which results from the appearance of the new shoulder with maximum at 414 nm observedin the spectrum above pH 4. At higher pH values, above 8, in the presence of air, fast autooxidation of GA occurs what excludes any further measurements using stationary techniques. The presented above fluorescence data also confirm the existence of the two forms of GA. One, neutral form, (Ia), with emission maximum at 368 nm and another, anionic form, (Ib), with emission maximum at 347 nm. Apparent pKa = 2.4 calculated from Fig. 3 is much lower than that obtained from absorbance data. This indicates that in the lowest excited state GA molecule becomes more acidic then in ground state. These changes are related to the changes in charge distribution between the ground and excited states.
|
In excited state of the GA molecule there should be a substantial decrease of electron density at carboxylic hydroxy oxygen atom leading to deprotonation at lower pH than in buffer. The dielectric microenvironment experienced by GA during its biological action would be significantly lower than in the bulk aqueous phase thus we investigated the fluorescence properties of GA in environments of lower polarity and different protic properties. Because above pH 3.2 GA is a negatively charged molecule we also checked how it binds and partitions with positively charged micelles. In neutral micelle TRITON X-100, DMSO and anionic micelles, SDS, no changes in fluorescence spectra of GA compared to buffered solutions were noticed except that for the last one the inten sities are lower by about 20%. |
|
In β-cyclo dextrin small changes in position, 1 nm of red shift, and the emission intensity, 2%, were observed. In the presence of cationic micelle TTABr some significant changes in fluorescence spectra of GA are observed. The fluorescence intensities of GA in the presence of micelle are at least two times higher compared to aqueous solutions. The positions of the fluorescence maxima are shifted with increasing pH of the solution what is shown in Figure 3. It shows that in all pH range the maximum emission is blue shifted compared to the maximum observed in buffered solution. Calculated apparent pKa is about 4 compared to 2.4 found in buffered only solution. In micellar environment the process of autooxidation is shifted toward higher pH compared to buffered solution. |
|
It suggests that the presence of micelles protect, to a certain degree, GA molecules from autooxidation.
Above pH 4 in the presence of TTABr micelles the new peak at 396 nm appears. The emission spectrum in TTABr is superposition of two peaks.
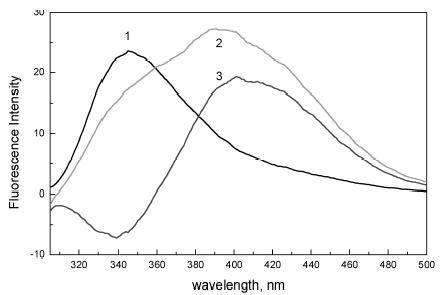
One peak is characteristic for the GA molecules in buffer with maximum at 347 nm. The other peak located at 397 nm, reflects the GA molecules interacting with the micellar environment. Examples of the emission spectra of GA in buffer and in TTABr at pH 6 are presented in Fig. 4. After subtraction the new spectrum with maximum at 405 nm is revealed. It seems obvious that this peak represents that part of GA anions, which interact with cationic micelle and this band will be used to determine the partition of GA molecules between phases.
In all organic solvents used different intensity changes and different shifts of the fluorescence maximum compared to that in water are observed.
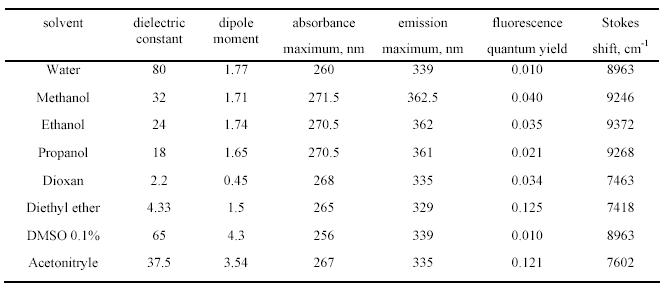
The positions of the peaks, fluorescence quantum yields and Stokes shifts are collected in Table 1. In dioxane and in acetonitrile the emission maximum is located at 335 nm, in diethyl ether at 329 nm. In methanol, ethanol and propanol the peak maxima are located around 362 nm and in water the maximum is located at 339 nm. The fact that the two solvents like methanol, protic, and acetonitrile, non-protic, with similar dielectric constants exhibit difference between positions of maxima and distinct intensities indicates that in protic and non-protic solvents two different types of interaction mechanisms occur. Additionally, in the investigated alcohols the spectral properties of GA are very similar, see Table 1. Lower fluorescence intensities, red shift of the peak positions and similar positions of the maxima of GA observed in the presence of protic solvents, like alcohols, indicates on a very probable formation of hydrogen bonds between GA and solvent. The fact that GA in water exhibits spectral properties, except intensity, which are closer to protic solvents, than to alcohols is an indication that GA molecule in aqueous solutions exists as hydrated molecule. In dioxane GA shows maximum at 335 nm characteristic for non-protic solvents but it shows rather low quantum efficiency comparable with the other protic solvents. It may come from the fact that dioxane is able to form hydrogen bonds and despite its low dielectric constant behaves as a protic solvent (Schmitke et al., 1997). In non-protic solvents the observed increasing quantum yield,
|
Table 1. Spectral and physico-chemical properties of gallic acid (GA) in different solvents. Dielectric constant, dipole moment D, abosrbance and emission maxima nm, fluorescence quantum yield and Stokes shift cm-1. |
|
|
| Data for dielectric constants and dipole moments taken from P.W. Atkins, Physical Chemistry, ed. Freeman, New York, 1985 |
higher energy of emission and lower Stokes shift indicate that excited energy is dissipated to surrounding less efficient then in polar solvents.
The lack of any additional band in non-protic solvent in absorbance spectra excludes the formation of ground state complex. In excited state the formation of new entity, like excimer or dimer and GA molecule may occur. Especially, that GA molecule is prone to form such dimer because of the presence of carboxylic moiety in its structure.
That carboxylic moiety is bearing donor function of OH group and acceptor function of C=O group.
Therefore they may form very stable hydrogen bonded dimers, especially in nonprotic solvents.
However, the data presented in Table 1, like blue shift and higher quantum yield compared to protic solvents, indicates that emission occur from monomeric forms of GA molecules. This indicates on the van der Waals interactions between excited GA molecules and solvent molecules.
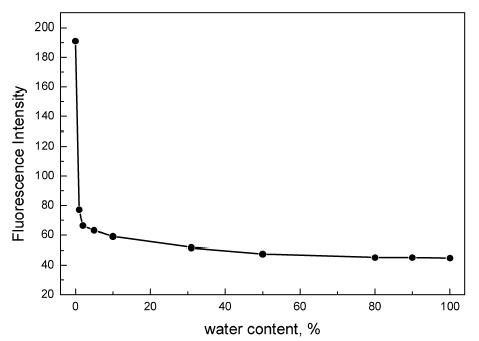
The absorption and emission spectra of GA in glycerin and glycerin-water mixtures were taken in order to explore the influence of viscosity on the observed phenomena. The plot of fluorescence intensity at its maximum versus water content is given in Fig. 5. The sudden drop of the fluorescence intensity when water is added to the system is observed. This confirms again that hydrogen bond formation is the main phenomenon in protic solvents, which is responsible for the spectroscopic properties of GA.
The observed intensity increase, spectral shift and newly formed peak indicates that in the presence of cationic detergent occur some interactions which lead to partition of GA forms between aqueous and micellar phases. Because the hydrophilic character of GA molecule prevents it from entering micellar interior, the main force responsible for the observed spectrum is an electrostatic interaction between charged micelle and GA anion.
Fluorescence quenching and partition studies
In order to estimate how GA molecules are distributed between micellar and aqueous phase we used the spectra, which characterize GA in aqueous solutions, peak at 347 nm, and micellar solutions, peak at 405 nm. The method was described in the Methods section. Calculated area under that band divided by the area of the whole spectrum recorded in micellar phase gave the partition coefficient.
Obtained that way values indicate that at pH 4.2 about 70% of GA molecules interact with micellar environment. This partition is slowly decreasing with pH and starting from pH 5.4 it remains constant at 50% up to pH 7. Taking into account the fact that the micelle concentration at given condition is two orders of magnitude higher than concentration of GA molecules, this behavior may reflect the process connected with concentration equilibrium between excited GA anions and available cationic micelles.
|
To explain this problem we observed the behavior of GA emission recorded at 405 nm with increasing concentration of TTABr micelle. The results are presented in Fig. 6. At low concentration of TTABr, bellow 1.5 mM, the GA fluorescence is quenched. Above 1.5 mM the emission intensity shows sharp increase what arises from the interactions between single molecule of TTABr and GA. Above 7 mM TTABr, close to critical micelle concentration (cmc) literature value for that detergent (Womack, Kendall & MacDonald, 1983), the emission increases much slower compared to the premicellar concentrations of the detergent. This comes from the fact that in micelles the existence of so called Stern layer, where up to 70% of counterions reside, may repulse part of the anionic GA molecules. |
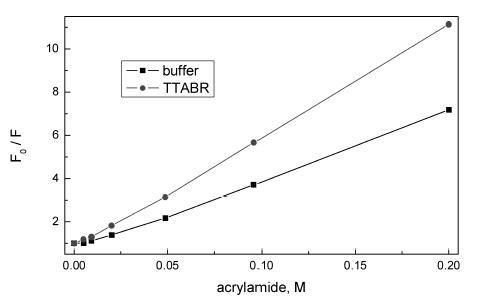
Quenching studies were carried out to determine the localization of GA molecules and determine how GA molecules interact with micelles. The results are presented as the Stern-Volmer plot in Fig. 7. It shows the data for GA in solution at pH 6 in the presence of detergent and without. The fluorescence intensities are monitored at 347 nm and 405 nm, which describe the GA molecules in aqueous and micellar phase respectively. In buffer solutions and in the presence of detergent, the plots are straight lines with larger slope in micellar environment. The calculated quenching constant vary from KSV = 16.7 M–1 in buffer to KSV = 19.2
M–1 (at 347 nm in micelle) and 48 M–1 (at 405 nm) in TTABr. Those results indicate that quencher has equal access to GA molecules in bulk phase in both environments. In micellar environment more efficient quenching occurs. This indicates that GA molecule definitely is not embedded into micellar interior and quenching is the result of the electrostatic interactions between charged GA anion, cationic micelle TTABr and a quencher. The higher quenching constant of GA in micelle may come from the fact that electrostatic interaction between quencher ion with cationic micelle changes the concentration homogeneity of quencher molecules around micelle. This causes that more fluorophores are adjacent to a quencher at the moment of excitation and the deactivation process is more efficient.
Quantum-mechanical calculations
|
Using PM3 semi-empirical method we calculated the distribution of electron density for ground and few lowest excited states for neutral and ionic forms of GA. Those calculations show that electron density distribution in ground state are mainly located on the aromatic ring and oxygen O atoms of hydroxyl groups attached to the aromatic ring. In the lowest excited states the electron density is still mainly located on aromatic ring however some of electronic charge is shifted to the carboxylic moiety. The calculation also have shown that GA molecule in neutral and anionic form in the ground state may form five to eight hydrogen bonds with water molecules. Distribution of electron density on the flexible groups, especially when connected through hydrogen bonds to surrounding environment, forms many paths to deexcite GA molecule and may explain observed low fluorescence quantum yield in protic solvents. |
These calculations confirm our conclusions based on the experimental results that in protic solvent GA molecule exists as a highly hydrated molecule.
DISCUSSION
The presented results show that GA absorbance and fluorescence (intensity, emission maximum and shape) depend on the pH of the solvent. The apparent pKa values of GA obtained from our experiments are close to pKa1=3.13 and pKa2=8.45 as reported by Bykova et al. (1970). An examination of chemical structure of GA shows that there are two ionizable moieties in the GA molecule: the carboxylic group and three phenolic hydroxyl groups. The first pKa value for that molecule is connected with ionization at carboxylic group. At basic pH, above pH 8.5, the observed maximum at 295 nm is very probably associated with ionization of the proton of 8-hydroxy group because 5-OH group has very high pKa due to efficient intramolecular H bonding. Such coincidence found for the pKa values clearly indicates that observed changes are not due to solely excited-state processes but rather are connected with ionization state of the GA molecule where neutral and anionic forms are present. The effect of micelles on the protonation equilibrium of GA can be explained on the basis of the pseudophase ion exchange model (Romsted & Zanette, 1988). In terms of this model, the shifts in pKa values, compared to buffer solution, is caused by transfer of GA monoanion into cationic surface of TTABr. This leads to new the neutral-monoanion equilibrium at higher pH.
In the lowest excited state GA molecule undergoes dissociation at lower pH, 2.7, what indicates on the charge decrease on the oxygen atom in OH group in carboxylic moiety. In micelle in the excited state the new neutral-monoanion equilibrium at pKa = 4 is established which is close to that in ground state, 4.5. This indicates that interaction between micelle and GA molecules is independent on protic properties of solvent and this driving force is an electrostatic interaction.
Absorption spectrum of pyrogallol, a compound that has structure similar to GA except is devoid of carboxylic group, do not exhibit any shift in water and organic solvents and its absorbance maximum positions are similar to that observed for GA. For propyl gallate, derivative of GA with carboxyl group replaced by propyl group, the absorption maximum in water is shifted to 269 nm. This data suggest that hydrogen bonding interactions is the main interaction in protic solvents and that absorption spectrum is subject to change when significant changes in the electronic distribution in the GA molecule occurs, i.e. like a new, more hydrophobic propyl moiety is attached.
The variation of fluorescence quantum yield of GA with pH can be further interpreted by use of the rotamer model based on the quantummechanical calculation. According to this model this process may be rationalized in terms of electrostatic repulsion between deprotonated oxygen from carboxylic group and π-electrons from aromatic ring. In case of neutral form, at pH<pKa1, such interactions are much weaker and whole group may rotate freely then dissipation of excitation energy is very efficient and yield of fluorescence is very low. At pH>pKa1 but lower than pKa2 GA will exist predominantly as anion. This is due to stabilization gained from the energetically favorable electrostatic interactions between negatively charged hydroxyl oxygen from carboxylic group and π-electrons from aromatic ring. Thus the molecule becomes more rigid and fluorescence quantum yield increases. This model calculated for the molecule in vacuum is probably correct for neutral form of GA, where quantum yield is indeed very low. In protic solvents where efficient hydration of GA molecule occurs the steric hindrance is canceled by the attached solvents molecules what efficiently dissipate excitation energy and even for anionic form the fluorescence quantum yield is low.
Incubation of GA acid with DODAB membranes, data not shown, β-cyclodextrin and micelles did not result in appreciable partitioning or binding, as evidenced by a lack of change of fluorescence maximum, quantum yield and quenching.
The inability of GA to bind to the membrane and micelles could be attributed to its insufficient hydrophobicity.
In physiological conditions interactions between molecules occur in the dielectric microenvironment which is different then aqueous and additionally depend on the hydrophobic nature of the molecule. The obtained results indicate that the binding of GA to involves some type of specific polar interactions. The fact that neutral GA molecule does not interact with cationic micelle whereas anionic GA molecules interact with cationic micelle easily indicates on electrostatic forces as a main mechanism responsible for that phenomenon.
The results of spectroscopic studies reported here indicate that GA molecule may exert its biological role by combining its electrostatic and hydrogen bonding properties according to actual microenvironment.
Acknowledgmen
This work was supported by grant DS 508/82-2 from the Agricultural University of Poznań, Poland. The authors wish to thank to Mr Piotr Rolewski for a great technical assistance during measurements.
GALLIC ACID
MSDS Number: G0806 ---
Effective Date: 10/29/011. Product Identification
Synonyms:
3,4,5-Trihydroxybenzoic acid, monohydrate; gallic acid, monohydrateCAS No.:
149-91-7 (Anhydrous) 5995-86-8 (Monohydrate)Molecular Weight:
188.14Chemical Formula:
C6H2(OH)3COOH.H2OProduct Codes:
J.T. Baker: M685Mallinckrodt: 3112
2. Composition/Information on Ingredients
Ingredient CAS No Percent Hazardous
--------------------------------------- ------------ ------------ ---------
Gallic Acid 149-91-7 100% Yes
3. Hazards Identification
Emergency Overview
--------------------------
CAUTION! MAY CAUSE IRRITATION TO SKIN, EYES, AND RESPIRATORY TRACT.
J.T. Baker SAF-T-DATA
(tm) Ratings (Provided here for your convenience)-----------------------------------------------------------------------------------------------------------
Health Rating: 1 - Slight
Flammability Rating: 1 - Slight
Reactivity Rating: 0 - None
Contact Rating: 1 - Slight
Lab Protective Equip: GOGGLES; LAB COAT
Storage Color Code: Orange (General Storage)
-----------------------------------------------------------------------------------------------------------
Potential Health Effects
----------------------------------
There is insufficient data in the published literature to perform a complete hazard evaluation for this product.
Special precautions must be used in storage, use and handling. Protective equipment should be chosen using
professional judgment.Inhalation:
May cause irritation to respiratory tract resulting in coughing and sneezing.
Ingestion:
Low systemic toxicity. Large amounts may cause some gastrointestinal discomfort, nausea or diarrhea.
Skin Contact:
May cause irritation to the skin with redness or minor inflammation on moist skin.
Eye Contact:
May cause eye irritation due to possible temporary abrasiveness. Can cause redness, tearing and possibly some pain.
Chronic Exposure:
No information found.
Aggravation of Pre-existing Conditions:
No adverse health effects expected.
4. First Aid Measures
Inhalation:
Remove to fresh air. Get medical attention for any breathing difficulty.
Ingestion:
Give several glasses of water to drink to dilute. If large amounts were swallowed, get medical advice.
Skin Contact:
Wash exposed area with soap and water. Get medical advice if irritation develops.
Eye Contact:
Wash eyes with plenty of water for at least 15 minutes. Call a physician.
5. Fire Fighting Measures
Fire:
As with most organic solids, fire is possible at elevated temperatures or by contact with an ignition source.
Explosion:
Not considered to be an explosion hazard.
Fire Extinguishing Media:
Water spray, dry chemical, alcohol foam, or carbon dioxide.
Special Information:
In the event of a fire, wear full protective clothing and NIOSH-approved self-contained breathing apparatus with full facepiece operated in the pressure demand or other positive pressure mode.
6. Accidental Release Measures
Remove all sources of ignition. Ventilate area of leak or spill. Wear appropriate personal protective equipment as specified in Section 8. Spills: Sweep up and containerize for reclamation or disposal. Vacuuming or wet sweeping may be used to avoid dust dispersal.
7. Handling and Storage
Keep in a tightly closed container, stored in a cool, dry, ventilated area. Protect against physical damage. Protect from light. Containers of this material may be hazardous when empty since they retain product residues (dust, solids); observe all warnings and precautions listed for the product.
8. Exposure Controls/Personal Protection
Airborne Exposure Limits:
None established.
Ventilation System:
A system of local and/or general exhaust is recommended to keep employee exposures as low as possible. Local exhaust ventilation is generally preferred because it can control the emissions of the contaminant at its source, preventing dispersion of it into the general work area. Please refer to the ACGIH document, Industrial Ventilation, A Manual of Recommended Practices, most recent edition, for details.
Personal Respirators (NIOSH Approved):
For conditions of use where exposure to dust or mist is apparent and engineering controls are not feasible, a particulate respirator (NIOSH type N95 or better filters) may be worn. If oil particles (e.g. lubricants, cutting fluids, glycerine, etc.) are present, use a NIOSH type R or P filter. For emergencies or instances where the exposure levels are not known, use a full-face positive-pressure, air-supplied respirator. WARNING:
Air-purifying respirators do not protect workers in oxygen-deficient atmospheres.
Skin Protection:
Wear protective gloves and clean body-covering clothing.
Eye Protection:
Use chemical safety goggles. Maintain eye wash fountain and quick-drench facilities in work area.
9. Physical and Chemical Properties
Appearance:
Fine crystals, white yellowish-white or pale, fawn-colored.
Odor: Odorless.
Solubility:1.1g/100ml water @ 20C (68F) (anhydrous).
Density: 1.7 (anhydrous)
pH: No information found.
% Volatiles by volume @ 21C (70F): 1
Boiling Point: Not applicable.
Melting Point:
250C (482F)Vapor Density (Air=1):
No information found.Vapor Pressure (mm Hg):
No information found.Evaporation Rate (BuAc=1):
No information found.10. Stability and Reactivity
Stability: Stable under ordinary conditions of use and storage.
Hazardous Decomposition Products: Carbon dioxide and carbon monoxide may form when heated to decomposition.
Hazardous Polymerization: Will not occur.
Incompatibilities: Ferric salts, ammonia, strong oxidizing agents, alkalis, nitrous ether, lead acetate, silver salts, chlorates, permanganate..
Conditions to Avoid: No information found.
11. Toxicological Information
For Anhydrous form: Oral rat LD50: 5g/kg. Investigated as a mutagen, reproductive effector.
--------\CancerLists\--------
|
NTP Carcinogen |
||||||||||
|
|
|
12. Ecological Information
Environmental Fate:
No information found.Environmental Toxicity:
Harmful to aquatic life in very low concentrations.13. Disposal Considerations
Whatever cannot be saved for recovery or recycling should be managed in an appropriate and approved waste disposal facility. Processing, use or contamination of this product may change the waste management options.
State and local disposal regulations may differ from federal disposal regulations. Dispose of container and unused contents in accordance with federal, state and local requirements.
14. Transport Information
Not regulated.
1
5. Other InformationNFPA Ratings:
Health: 1 Flammability: 0 Reactivity: 0Label Hazard Warning:
CAUTION! MAY CAUSE IRRITATION TO SKIN, EYES, AND RESPIRATORY TRACT.
Label Precautions:
Avoid contact with eyes, skin and clothing.
Wash thoroughly after handling.
Avoid breathing dust.
Keep container closed.
Use only with adequate ventilation.
Label First Aid:
In case of contact, immediately flush eyes or skin with plenty of water for at least 15 minutes. If irritation develops call a physician. If inhaled, remove to fresh air. Get medical attention for any breathing difficulty.
Product Use:
Laboratory Reagent.
Revision Information:
MSDS Section(s) changed since last revision of document include: 1, 8, 12.
Disclaimer:
***********************************************************************************************
ALNICOLSA del Perú S.A.C. provides the information contained herein in good faith but makes no representation as to its comprehensiveness or accuracy. This document is intended only as a guide to the appropriate precautionary handling of the material by a properly trained person using this product.
Individuals receiving the information must exercise their independent judgment in determining its appropriateness for a particular purpose. ALNICOLSA del Perú S.A.C. MAKES NO REPRESENTATIONS OR WARRANTIES, EITHER EXPRESS OR IMPLIED, INCLUDING WITHOUT LIMITATION ANY WARRANTIES OF MERCHANTABILITY, FITNESS FOR A PARTICULAR PURPOSE WITH RESPECT TO THE INFORMATION SET FORTH HEREIN OR THE PRODUCT TO WHICH THE INFORMATION REFERS. ACCORDINGLY, ALNICOLSA del Perú S.A.C. WILL NOT BE RESPONSIBLE FOR DAMAGES RESULTING FROM USE OF OR RELIANCE UPON THIS INFORMATION.
***********************************************************************************************
REFERENCES
Abella A. & Chalas J. (1997). Antioxidant activity of phenolic acids and esters present in red wine on human Low-Density Lipoproteins. Atherosclerosis, 134, 199-206.
Abu-Amsha Caccetta R., Burke V., Mori T.A., Beilin L.J., Puddey I.B.& Croft K.D. (2001). Red wine polyphenols, in the absence of alcohol, reduce lipid peroxidative stress in smoking subjects. Free Radic Biol Med, 30, 636-642.
Aoki K., Ishiwata S., Sakagami H., Kusama K.& Katayama T. (2001). Modification of apoptosis-inducing activity of gallic acid by saliva. Anticancer Res, 21, 1879-1883.
Arce L., Rios A.& Volcarcel M. (1998). Determination of Heterocyclic Aromatic Amines in Fried Beefsteak, Meat Extract, and Fish by Capillary Zone. J.Chromatogr., 827, 113-120.
Aruoma O.I., Murcie A., Butler J.& Halliwell B. (1993). Antioxidant and pro-oxidant properties of herbs. J. Agricul. Food Chem., 41, 1880-1885.
Bors W. & Michel C. (1999). Antioxidant capacity of flavanols and gallate esters: pulse radiolysis studies. Free Rad. in Biol. & Med., 27, 1413-1426.
Bykova L.N., Petrov S.I.& Blagodatskava Z.G. (1970). Relative acidity of phenol and its derivatives in a medium of nonaqueous solvents. Zh. Obshch. Khim., 40, 2295-3000.
Dowd P.F., Duvick J.P.& Rood T. (1997). Comparative toxicity of allelochemicals and their enzymatic oxidation products to maize fungal pathogens, emphasizing Fusarium graminearum. Nat Toxins, 5, 180-185.
Eftink M.R. (1991). Fluorescence techniques for studying protein structures.[In:] C. H. Suelter. (Eds.) Fluorescence techniques for studying protein structures (pp. 127-205). New York: John Wiley & Sons.
Heinonen I.M., Lehtonen P.J.& Hopia A.I. (1998). Antioxidant Activity of Berry and Fruit Wines and Liquors. J Agric Food Chem, 46, 25-31.
Ho C.T., Chen Q., Shi H., Zhang K.Q.& Rosen R.T. (1992). Antioxidative effect of polyphenol extract prepared from various Chinese teas. Prev Med, 21, 520-525.
Inoue M., Suzuki R., Sakaguchi N., Li Z., Takeda T., Ogihara Y., Jiang B.Y.& Chen Y. (1995). Selective induction of cell death in cancer cells by gallic acid. Biol Pharm Bull, 18, 1526-1530.
Kahkonen M.P., Hopia A.I., Vuorela H.J., Rauha J.P., Pihlaja K., Kujala T.S.& Heinonen M. (1999). Antioxidant activity of plant extracts containing phenolic compounds. J Agric Food Chem, 47, 3954-3962.
Kerry N.L. & Abbey M. (1997). Red wine and fractionated phenolic compounds prepared from red wine inhibit low density lipoprotein oxidation in vitro. Atherosclerosis, 135, 93-102.
Khan N.S., Ahmad A.& Hadi S.M. (2000). Antioxidant, pro-oxidant properties of tannic acid and its binding to DNA. Chem Biol Interact, 125, 177-189.
Koga T., Moro K., Nakamori K., Yamakoshi J., Hosoyama H., Kataoka S.& Ariga T. (1999). Increase of antioxidative potential of rat plasma by oral administration of proanthocyanidin-rich extract from grape seeds. J Agric Food Chem, 47, 1892-1897.
Lakowicz J.R. (1983). Principles of fluorescence spectroscopy, Plenum Press: New York and London.
Landrault N., Poucheret P., Ravel P., Gasc F., Cros G.& Teissedre P.L. (2001). Antioxidant capacities and phenolics levels of French wines from different varieties and vintages. J Agric Food Chem, 49, 3341-3348.
Lee M.W., Lee Y.A., Park H.M., Toh S.H., Lee E.J., Jang H.D.& Kim Y.H. (2000). Antioxidative phenolic compounds from the roots of Rhodiola sachalinensis A. Bor. Arch Pharm Res, 23, 455-458.
Li A.S., Bandy B., Tsang S.S.& Davison A.J. (2000). DNA-breaking versus DNA-protecting activity of four phenolic compounds in vitro. Free Radic Res, 33, 551-566.
Masaki H., Atsumi T.& Sakurai H. (1995). Peroxyl radical scavenging activities of hamamelitannin in chemical and biological systems. Free Radic Res, 22, 419-430.
Metelitza D.I., Eryomin A.N., Sviridov D.O.& Kamyshnikov V.S. (2001). Initiation and inhibition of free radical processes in H2O2- metmyoglobin (methemoglobin)-2,2'-azino-bis-(3-ethylbenzthiazoline-6- sulfonic acid) systems. Biochemistry (Mosc), 66, 505-514.
Milic B.L., Djilas S.M.& Canadovic-Brunet J.M. (1998). ESR spin-trapping studies of influence of phenolic compounds on hydroxyl radicals formation. Food Chem., 61, 443-447.
Pulido R., Bravo L.& Saura-Calixto F. (2000). Antioxidant activity of dietary polyphenols as determined by a modified ferric reducing/antioxidant power assay. J Agric Food Chem, 48, 3396-3402.
Romsted L.S. & Zanette D. (1988). Micellar pseudophases in acidic environment J.Phys.Chem., 92, 4690.
Sakagami H., Satoh K., Hatano T., Yoshida T.& Okuda T. (1997). Possible role of radical intensity and oxidation potential for gallic acid-induced apoptosis. Anticancer Res, 17, 377-380.
Satoh K., Ida Y., Sakagami H., Tanaka T.& Fujisawa S. (1998). Effect of antioxidants on radical intensity and cytotoxic activity of eugenol. Anticancer Res, 18, 1549-1552.
Schmidt K.N., Traenckner E.B., Meier B.& Baeuerle P.A. (1995). Induction of oxidative stress by okadaic acid is required for activation of transcription factor NF-kappa B. J Biol Chem, 270, 27136-27142.
Schmitke J.L., Stern L.J.& Klibanov A.M. (1997). The crystal structure of subtilisin Carlsberg in anhydrous dioxane and its comparison with those in water and acetonitrile. Proc Natl Acad Sci U S A, 94, 4250- 4255.
Sroka Z., Rzadkowska-Bodalska H.& Mazol I. (1994). Antioxidative effect of extracts from Erodium cicutarium L. Z Naturforsch [C], 49, 881-884.
Terasaka H., Tamura A., Takayama F., Kashimata M., Ohtomo K., Machino M., Fujisawa S., Toguchi M., Kanda Y., Kunii S., Kusama K., Ishino A., Watanabe S., Satoh K., Takano H., Takahama M.& Sakagami H. (2000). Induction of apoptosis by dopamine in human oral tumor cell lines. Anticancer Res, 20, 243-250.
Womack M.D., Kendall D.A.& MacDonald R.C. (1983). Detergent effects on enzyme activity and solubilization of lipid bilayer membranes. Biochim Biophys Acta, 733, 210-215.
Zheng W. & Wang S.Y. (2001). Antioxidant Activity and Phenolic Compounds in Selected Herbs. J Agric Food Chem, 49, 5165-5170.
COPYRIGHT
© 2000 - 2003
ALNICOLSA del Perú S.A.C.
Prohibida su
reproducción total o parcial, así como su traducción a cualquier idioma sin
autorización escrita de su titular
Reproduction in whole or in part, or translation without written permission is
prohibited. All rights reserved